
Fourteen months ago I commenced a Type Rating on the BAe146 aircraft. After 20 years on the Boeing 777 it was something of a reset. Almost the first thing I did after checkout in the simulator was to travel to Cologne, Germany to Test fly and deliver an additional BAe146-300 aircraft to Australia. Yet another unique experience in a very, very fortunate career in aviation for me. But eventually I commenced line operations in the aircraft, conducting night freight operations up and down the East Coast of Australia and Adelaide for Pionair Australia.
 I think it’s fair to say that the change-shock that came with the aircraft change was not the only paradigm shifting experience foisted on my brain since COVID hit our industry. I was now flying freight, working for a charter organisation that functioned on a more limited budget than the airlines I had been used to. I was introduced to flying four sectors in a duty, instead of one, with 30 minute turn arounds, instead of 90 (or 24 hours!). The pace of the operation, and the tempo, was entirely different.
Like any introduction to a new aircraft and a new operation – you aren’t taught – you don’t learn – everything you need to know at once. Long after checkout you discover aspects of your operation and the wider operation at large that require you to think and incorporate aspects into your personal operation to deal with. In most cases my most immediate problem was the quick access to accurate information to support either the operation at large – or my operation. As has always been my inclination (or limitation some would say) – I ended up solving the issues through a clipboard insert (harkening back to the early days of my problem solving). Another was the development of an Excel Spreadsheet to track and check various aspects of the numbers that were flying in all directions across and around the flight deck and the freight operation. Because Microsoft have done a decent job of placing MS Excel at our fingertips on the iPad – I decided to take advantage of it.
BAe146 Excel Calculator
I don’t pretend that this would be useful for anyone else – not even anyone else operating 146 aircraft on freight operations in Australia. But I’ve consistently found it to help me trap errors and omissions, and save me time on the ground and in the air.
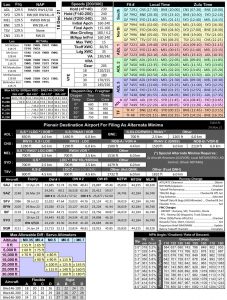
The spreadsheet is constructed around two main sections – the DFR and the Sectors. There are various support worksheets containing tables of data (laboriously entered and cross-checked from the FCOM and other sources) but while these are foundational to the functionality of the workbook, they are incidental to the operation so I won’t go into them.
Training Videos
I can’t believe anyone is going to read any of this (which begs the question why I wrote it – yes, I know I have a problem) – so I recorded a few short videos to step through the process.
- Initial Setup of the DFR Tab : Excel-ing in the BAe146 – 1 of 5 – Setting up the DFR
- A quick look at the Max FDP Tab : Excel-ing in the BAe146 – 2 of 5 – Max FDP
- First Sector Departure : Excel-ing in the BAe146 – 3 of 5 – Departure
- First Sector Arrival : Excel-ing in the BAe146 – 4 of 5 – Arrival
- Back to the DFR to finish : Excel-ing in the BAe146 – 5 of 5 – Back to the DFR
Daily Flight Record (DFR)
At the end of each flight, I have to check the DFR. This has either been completed by myself of the other pilot (or both) and if I get something wrong – someone emails me about it. On top of that – I’m always coming across corrections made to the total hours of the aircraft made by engineering after the adding mistakes of pilots, so I decided to add this page to the calculator, fill it in as I went and use it to cross check at the end of the flight. At the end of our flights we’re either driven by the requirement to handover to the next crew (who are on a time constraint themselves to get away) or engineering (who want to tow the aircraft) – or we just want to go to bed. All of these don’t facilitate a good detail checking environment.
List boxes … Everywhere.
 The first thing to note is that because this sheet is intended for iPad use – where the keyboard can be a pain to use – I have implemented list box. Everywhere. Lots and Lots of list boxes. And they’re smart. Let me explain.
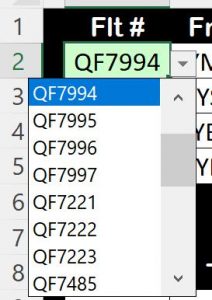
List boxes allow you to select from a pre-loaded set of options for a cell. Some of them look obvious – Where you see a flight number (QF7994) the list box contains a pre-built list of the flights operation by the company. Thus rather than having to enter it in (which may well be faster on a laptop if you can type) – you can choose from the list – faster on the Ipad and comes with the added benefit of being a valid flight number by design.
Expanding that concept. The trick is to fill the list box not just with all possible options – but to limit the box to just the values that are likely to be useful. This often reduces dozens of possibilities down to just a few.
- The list box for the Scheduled Departure time (a calculated field using a lookup based on the selected Flight number) contains pre-set time values, separated by 15 minute increments – starting 30 minutes after the Duty Sign On time.
- For Delay (which is actually a calculated field based on Schedule and Out Time) a list box containing “Nil” and 00:01 .. 00:02 .. 00:03 etc.
- The Out list (for the first sector) starts at Scheduled-15 and increases in 1 minute intervals. For the second sector it starts at a customisable default time after the previous sector In time.
- For Off (Takeoff)- time increasing in 1 minute intervals, starting 3 minutes after the Out time
- Day/Night contains a Day or Night selection. Choosing one disables (sort of) the Sunrise/Sunset cells
- Sunrise and Sunset are based on the Off times and increment in 6 minutes, giving an easy to use result of the Day/Night total of the first part of the sector.
- The Fuel boxes contain a pre-set list of fuel values that are typically used (6,000; 7,000; 8,800; etc). then starts at 1,000 and increase 100 kg to full tanks. This allows quick access to common values and flick-the-scroll-box access to all fuel values.
You can see I’ve put a lot of thought into the construction of these boxes. It’s cumbersome to set up – but when you get your fingers on the screen to manipulate entries it makes this a whole lot faster and easier to use.
List Boxes … for Calculated Cells?
The Excel experts will wonder why I am doing this? Because when you have a list box on a calculated field – if you select something, you destroy the calculation and replace it with the selected value. But in many, many cases – that’s the functionality you need. For example …
- On the Sector 1 tab, there is the Arrival Airport Weather. Values for Wind Direction, Wind Speed, Wind Gust, Temperature and Pressure. You enter these values in cruise when you get the ATIS information to assist with checking crosswind limits, thrust calculations, etc. There are of course list boxes on all of these controls to facilitate quick selection of values.
- But on the Sector 2 tab, there is a Departure Weather section. More often that not – most of the Departure Weather values are going to be the same as they were for the arrival.
- So I have used formulas on these cells to confirm that if the Departure Airport is the same as the previous sector Arrival Airport – the weather values are pre-filled from the previous sector arrival section.
- But of course – things change – so you can select changes to this pre-filled weather, destroying the calculation and setting the right values for your departure.
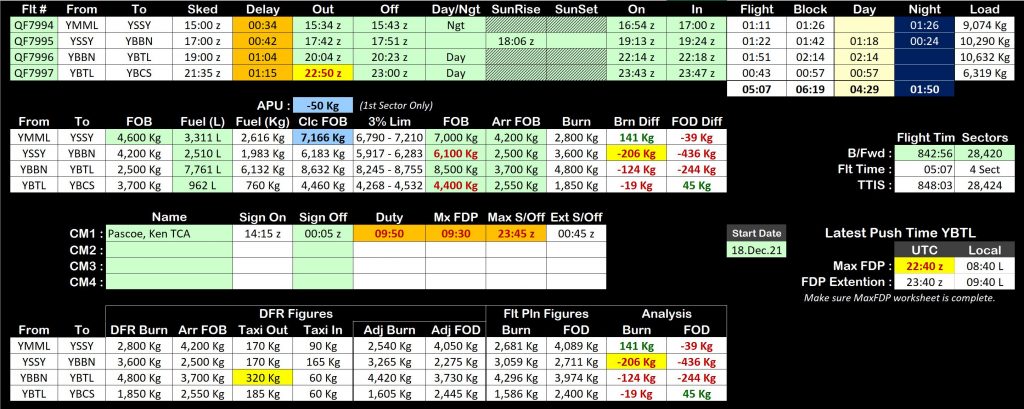
 This section is pretty straight forward – it records the basic details of the flight, calculates the departure delay, facilitates the splitting of the block time into Day/Night.
In principle – Green cells indicate areas where entries can be made, and usually are required to be made.
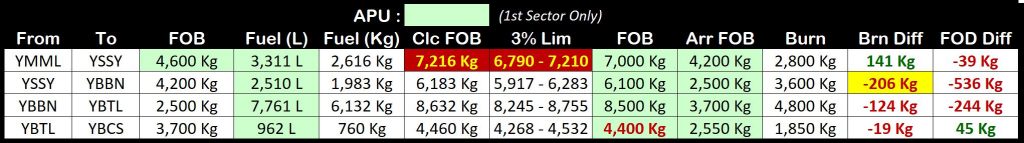 This section details the fuel block, indicating the limits of the +/- 3% check, highlighting when the check has failed (I removed the APU use from the example, resulting in a 3% check exceedance).
Red FOB values indicate a difference between what was recorded on the DFR vs what was planned/resulted in the Sector tab (in this case, Sector 4). The two columns at the end indicate the difference between planned fuel burn and actual fuel both, red meaning we used more fuel than the plan suggested; Red-on-Yellow indicating that this difference was more than the Variable fuel allocated to the sector.
The FOD (Fuel Over Destination) value indicates the difference between how much fuel we should have on board for the Landing vs how much there was – Red being once again, bad – less fuel available than planned. This last section gives me insight as to how the flight progressed in terms of fuel burn and fuel available for holding/diversion against the Flight Plan.
This last section takes as input the total (so far) of the aircraft’s flight time, adds today’s time and totals it up (as well as Landings) for the Maintenance Log. There is a quirk in excel limiting how many hours you can enter into a cell on the iPad – so 30,000+ hours hours was never going to work – I strip off the first two numbers until I have worked out how I am going to get around this little conundrum …
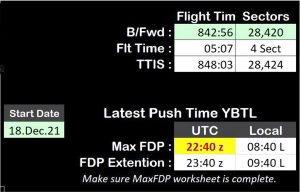
The section at the bottom concerns the relationship between the planned duty period and the maximum flight duty period with/without extension. What’s shown here is the latest push time for the last sector planned to meet Max FDP; and based on the additional hour usually available for duty extension, an hour later than that. There’s a worksheet dedicated to that (visual) calculation below.
The Sectors Worksheets (1-4)
For each of the sectors there is a different worksheet. While the Sectors are linked back and forth between the DFR sheet, and the Sector sheets look at each other as well – they are functionally identical to the point where I can make design changes in the Sector 1 worksheet, and when done – delete Sectors 2/3/4 and replace them with the updated Sector 1. It took a lot of fiddling to get me to that point …
There are five basic areas of the Sectors Worksheet …
Departure Airport Details
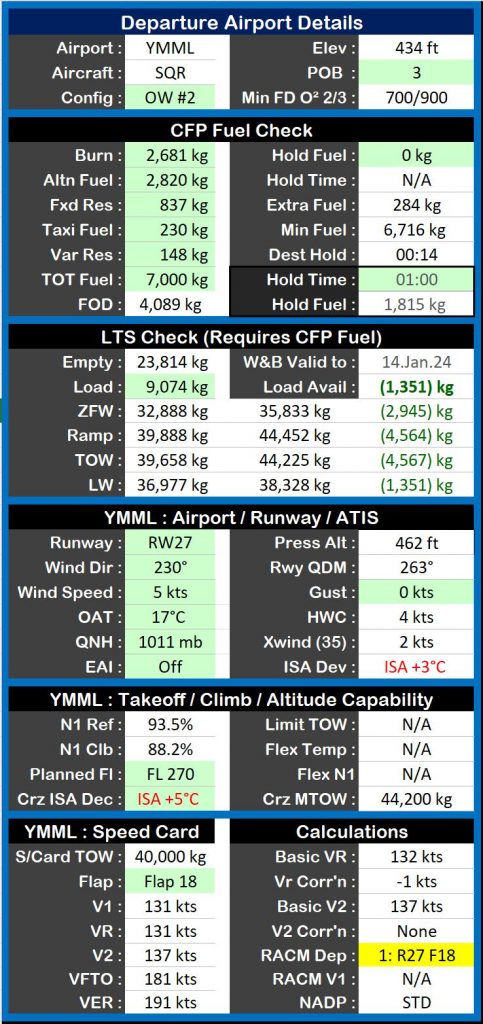
This section is divided into the following parts:
- Airport (taken from the DFR page)
- Aircraft – selected here on the 1st sector, then copied into the subsequent sectors (but of course it’s an unprotected formula with a list box populated with all available aircraft).
- Loadsheet Config (OW#2) – this determined the basic operating weight (including assigned crew) and Index Units of the aircraft on this sector.
- Airport Elevation – this is a calculated result based on the selected airport.
- POB : Number of persons on board
- Minimum Freighter Flight Deck Oxygen for 2/3 crew on the flight deck – the minimum oxygen pressure (psi) required for 2/3 crew on the flight deck (based on the OAT entered into the Departure Airport Weather).
Now we get into the Flight Plan … once I have received the flight plans for the sectors, I enter/select in the details as follows:
- Burn – Trip Fuel from Departure to Destination.
- Altn Fuel – Trip Fuel for any assigned Alternate. If there are two – I use the one requiring the most fuel.
- Fxd Res : Fixed Reserve Fuel (usually 30 minutes). The list box for this contains a pre-calculated 30 minute value at maximum landing weight (or the current landing weight in of the aircraft based on fuel/load).
- Taxi Fuel : The list box contains the standard 230 kg.
- Var Res : Variable Reserve, usually 5% of the Burn, with a minimum of 5 minutes of fuel. The list box contains the 5%/5min figure calculated by the sheet.
- TOT Fuel : Total Fuel, that is the Refuelling Figure that for the departure.
- Hold Fuel : Any planned Holding Fuel (kg). Below this is a Hold Time calculation which calculates the minutes the entered figure corresponds to, based on the FCOM figures at either planned or maximum landing weight.
- FOD : Fuel At Destination, as calculated based on the figures above.
- Hold Time : This field takes a number of minutes, with a series of pre-sets to choose from in the list box. Having selected a time value – the Hold Fuel calculated field below uses FCOM data to produce a Holding Fuel Kg figure equivalent. You can use this to add fuel to the flight based on holding requirements that pop up after the plan has been published.
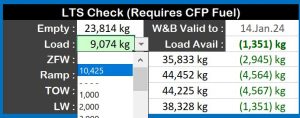
Now we move onto the Load/Trim Sheet check section. Only one value is required from the Loadsheet:
- Load : Entered in Kgs. The list box contains a value that is the calculated maximum load, based on the most limiting constraint of Maximum Zero Fuel Weight (ZFW); Take-Off Weight (TOW); or Landing Weight (LW). After that a series of values starting at 1,000k increasing are there to choose from.
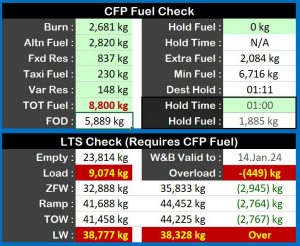 The LTS Check area allows me to validate the load sheet – but more importantly, I can vary the load to work out what limitations exist. If I need extra fuel – I can load this into the Flight Plan TOT Fuel cell, and see the result. There is a column of the weight limitations for ZFW, RAMP, TOW, LW as well as the additional load that each of these constraints will permit. If I add load or fuel and it exceeds one of the aircrafts limitations – this is immediately shown to me in Red.
We now move to the Departure Airport Runway/ATIS section.
- Runway : As to be expected – the list box is populated only with the runways for the departure airport (that a BAe146 can use). Once selected the runway QDM is displayed – and used for a higher level of crosswind/tailwind calculation.
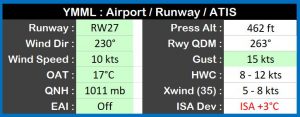 Wind Dir : The Wind Direction is entered in degrees – the list box is populated first with “Variable”; and then a degrees value starting at 360, 010 every ten degrees until back around at 360 – after that every degree is available.
- Wind Speed ; The Wind Speed from the ATIS.
- OAT : Outside Air Temperature from the ATIS. Once entered, this results in a calculation of Airport ISA Dev(iation) based on the temperature you selected and the calculated airport pressure altitude.
- QNH : The Air Pressure from the ATIS. Once entered this results in a Press Alt calculation from the selected QNH and Airport elevation.
- Gust : Any reported Gust is entered here. Later this value can be used (or ignored) for the purposes of Take-Off Performance calculation and tailwind/crosswind calculation. The gust list box lists all wind components in excess of the entered Wind Speed value.
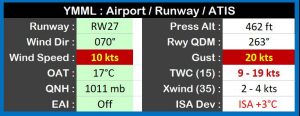 HWC (or TWC) : The Speed/Gust values of Headwind Component (HWC) or Tailwind (TWC) components. To separate values are shown where a Gust value was entered. Tailwinds are shown in Red. They are further emphasised (Yellow on Red) when they exceed the Take-off Tailwind Limit (either in Wind Speed or Gust). For TWC – the aircraft limit is shown – TWC (15).
- Xwind (35) : The calculated crosswind component is shown for the Wind Speed and Gust. If either exceed the aircraft limit (in this case 35 knots) they are emphasised in Red.
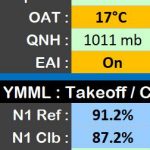 EAI : The selection of Engine Anti-Ice for Take-off is made here. This selection colors blue when ON; and colors Amber when both ON and the OAT entered is in excess of 10 degrees. When selected ON the N1 calculations (below) are shaded with a blue background as well.
Next should be the Takeoff/Climb/Altitude Capability and Speed Card/Calculations. However this is tied up with the RACM (Runway Analysis Charts Manual) calculations so I will move onto that instead.
That said … there is a small section here which examines the aircraft climb capability based on needing to have a 500 fpm climb capability at initial cruise altitude (FCOM table).
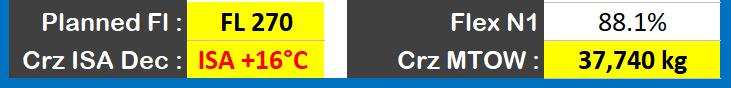 Select the Planned FL (Flight Level) and the Cruise ISA Dev(iation) from the Flight Plan – this results in a maximum TOW for the nominated Cruise Altitude/ISA Deviation. These are highlighted Yellow if the weight limit displayed exceeds the planned TOW (as does the planned TOW). Once again these are FCOM based figures using the selected aircraft (-200/-300).
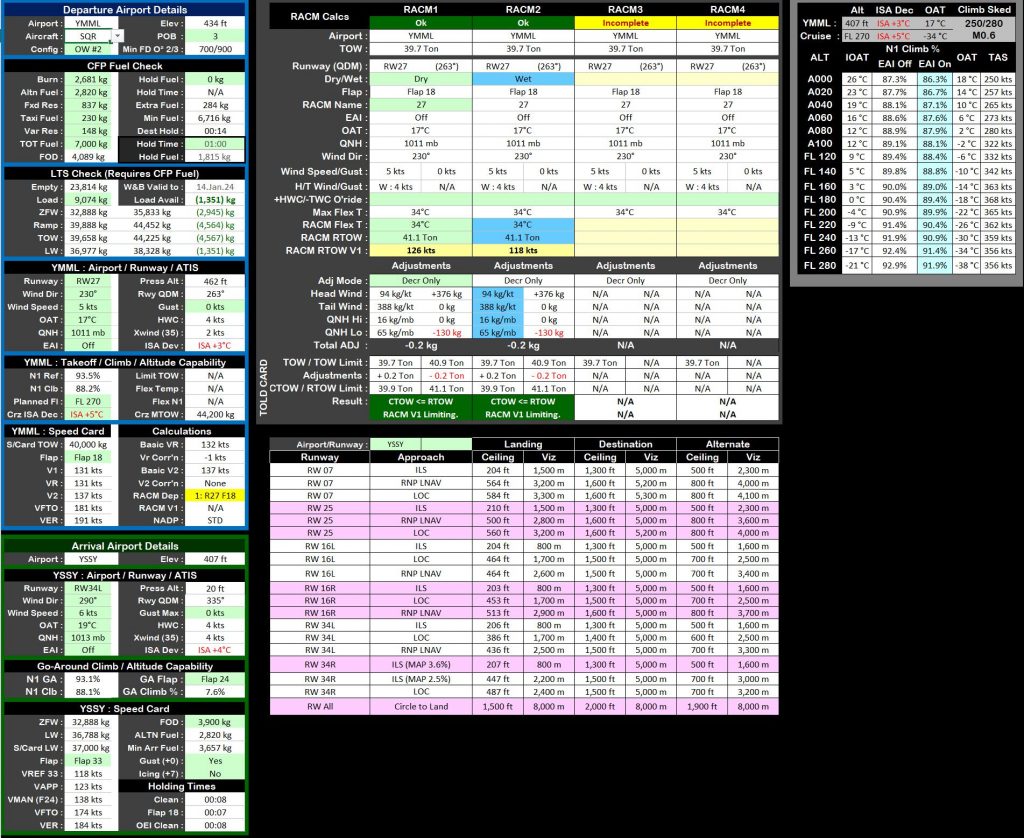
Runway Analysis Chart Manual Calculations
Our runway charts are a little … cumbersome. They come with a basic set of Weight Limits against Flex Temperature – that is, how much weight you can lift off the Runway for the Temperature De-Rate you want to use) as well as a limiting V1 for that line in the chart. Prior to this you need to choose the Airport, Runway (Intersection) and Flap Setting. Also whether the runway is Wet or Dry. After all that – there are a set of four corrections for HWC/TWC and +/- QNH corrections. Generally we only bother about the negative factors – lowering the RACM weight for Tailwinds and Low Pressure. You can find a training video on how this is all done here.
Working out one solution is not hard but, it’s a process. But when you come up against a limit and you are trying to optimise your solution to get the best engine de-rate against Flap/Runway Intersection/Wet-Dry, etc … it gets complex (particularly at 2AM).
Also – and I don’t mean to bitch here … but the FO works this out in his/her own sweet time while I walk around the outside of the aircraft – I come back and the pressure is now on for me to validate/optimise the solution so we can get on with the rest of our pre-dispatch activity (which all has to take place in as little as 20 minutes). I’m just saying the life of a Captain is not all the big pay check and full cream flat whites. Mostly.
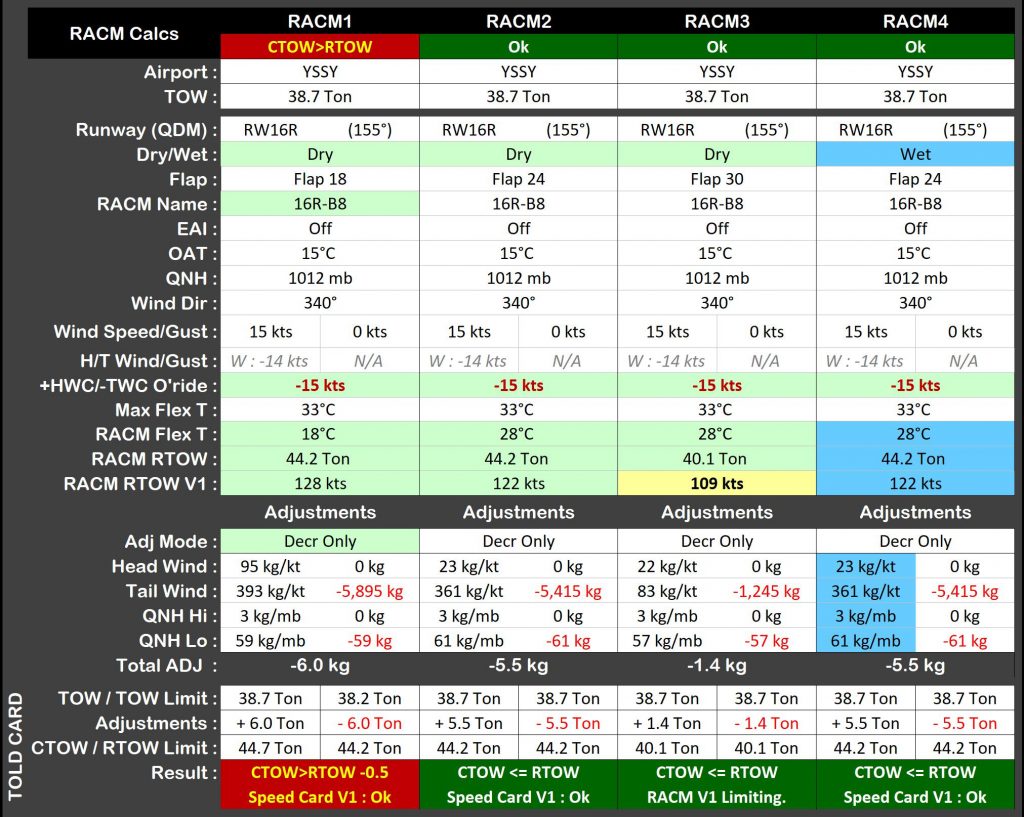
This (structure!) allows me to look at up to four different scenarios for take-off. The one shown here is a (relatively) heavy weight take-off from Sydney where runway works requires us to depart from intersection B8 (sound familiar). The runway is currently dry but I need to consider wet as wet as well.
- The Green cells reflect selections I can or need to make. I need to specify Dry/Wet; I need to specify the Runway/Intersection (16-B8); I do not have to – but have – specified a tailwind of 15 knots (ATIS calculates out at 14 knots).
- The white cells are calculated or coped in from the other areas of the Sector worksheet. But in all cases I can override and choose my own value. Hence I could look at two different runways against each other by changing the Runway selection at the top.
- The Adj Mode lets me leave the calculation into DECR ONLY (only look at the decrements) or I can choose to take advantage of any headwind or high QNH.
- The V1 I enter will highlight yellow if it is less than the Speed Card (balanced field) V1 for the Take-Off weight.
Right away I can see that I can’t use Flap 18. The weight penalty is too high (6 tons for the TWC/QNH). This is in part because the RACM charts top out at our structural TOW (44.2) rather than going higher to reflect a performance limit.
As it turns out – while the TWC decrement for Flap 30 is much less punishing (82kg/Kt as opposed to 361 kg/kt) the actual lifting capability is much less for Flap 30 (40.1 tons vs 44.2 at 28 degrees). Hence both solutions come out about the same – so I’ll go with Flap 24 and include a Flap 24/Wet calculation at the end.
The TOLD CARD section includes the TOW -> Adjustment -> CTOW -> RTOW -> Adjustment -> TOW Limit values for checking the TOLD Card provided by the other pilot.
Having developed a valid solution in this area of the worksheet – it’s time to move aforementioned Takeoff/Climb/Altitude Capability and Speed Card/Calculations section.
Takeoff/Climb and Speed Card Section
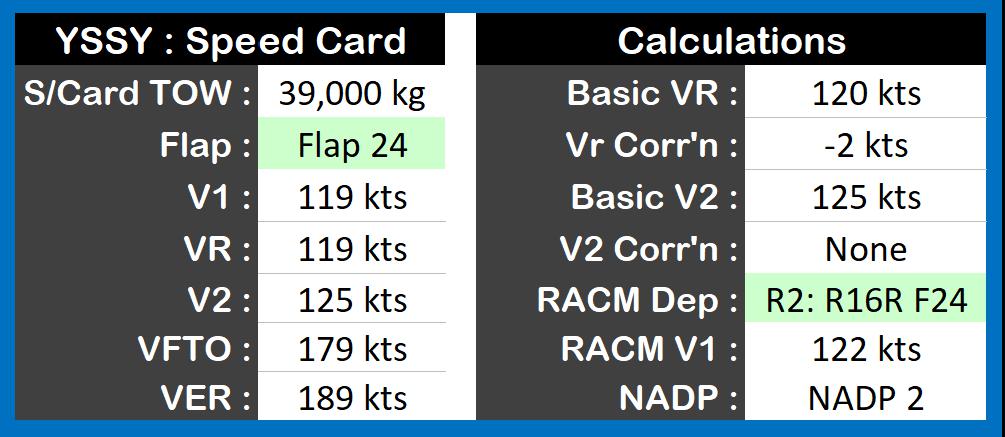
Having identified a solution (one of RACM1 / RACM2 / RACM3 / RACM4) – it’s selected into the RACM Dep cell. The Takeoff Flap must also be manually selected. If the manually selected Flap and the Flap selected from the RACM number don’t match – this is highlighted in Red.
Based on the S/Card TOW (rounded up from the previous TOW – but again it can be manually selected to override) the Take-Off Speeds are looked up in the FCOM tables. The Basic Vr/V2 is subject to correction based on weight and temperature (see Calculations Section); the V1 can be further limited by the value from the RACM calculation. The end result of this is the V1/Vr/V2, VFTO and VER on the left hand side. These are checked against the TOLD card.
The NADP Noise Abatement Profile for the Airport/Runway is also provided.
That brings us to the end of the Departure section. Now – onto the Arrival Airport. But before we go – let’s look at the Airport Minima feature.
Airport/Runway Minima
CASR 121 brings with it the requirement to basically always have an alternate unless the weather is good; moreover the criteria for identifying that need and the suitability of certain alternates in terms of forecast weather vs runway/approach minima with additives is complex – very complex at 2AM during a 20 minute turn around when the latest TAF3 was just issued.
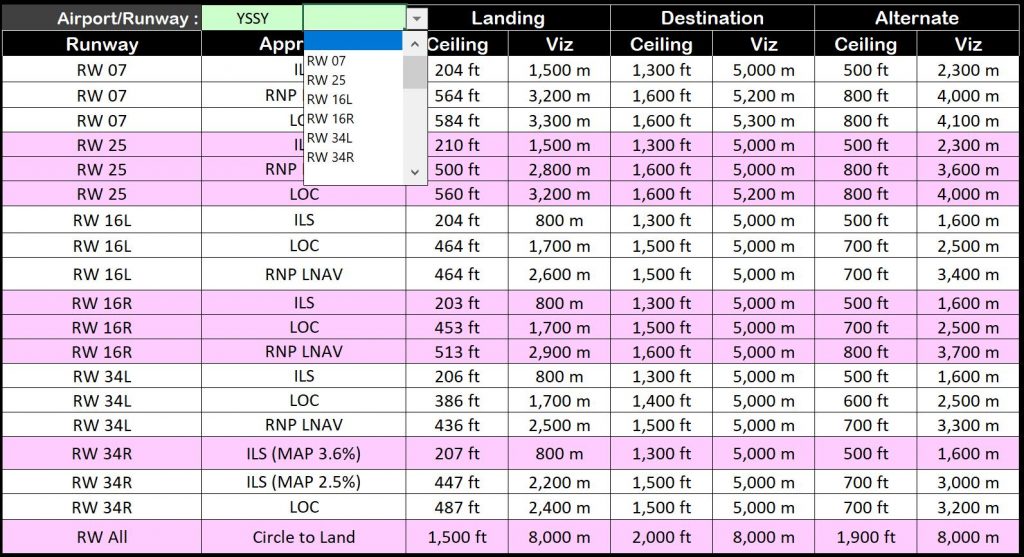
Accordingly I added a lookup for the Destination (need an alternate?); Landing and Alternate minima. There’s one in each worksheet and it contains a list of Airports, and for each airport a list of runways to further filter the minima’s. It’s just a time saver.
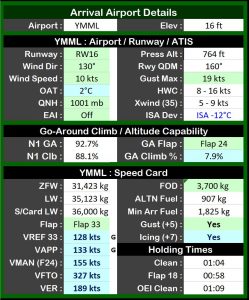 Arrival Airport
The arrival section facilitates the accurate calculation/lookup/crosscheck of approach speeds including Gust and Icing additives, as well as thrust calculations for go-around and holding times for fuel over destination against any Alternate requirement.
- The ATIS information is checked for incorrect use of EAI as well as checking crosswind and tailwind against the limits of that specific aircraft.
- The Speed Card speeds are based on the ZFW and the nominated Fuel Over Destination (FOD) and are (optionally) augmented by any Gust or Icing Allowance.
- Holding Times are estimated based on ambient conditions and Landing Weight and are provided for All Engine, Flap 18 and One Engine Inoperative holding.
If you look at all this and wonder if I am insane … stop wondering.
If you find my content useful and are in a position to do so – I would appreciate a contribution to my PayPal account (ken.pascoe@gmail.com) – If you use the Friends and Family feature in PayPal it reduces the charges to the transfer. Please note that when sending money in this way you are removing any form of purchase protection, which is not relevant to a contribution of this type anyway.
Regards, Ken Pascoe